Every industry gets a different Google
Page 1 is not one template Google applies everywhere. We measured how crowded each industry's results page is, which features are tied to which category, and which features tend to show up together.

Vaayam research | Data collected 26 September 2026
In our first piece we showed that the ten blue links are mostly gone. But "page 1 now has an AI Overview and some extra features" undersells how different those pages are by industry. We broke the same 9,734-keyword dataset down by category and found that Ecommerce pages are nearly a third more crowded than Finance pages, and that some features are almost entirely tied to a single industry.
Key findings
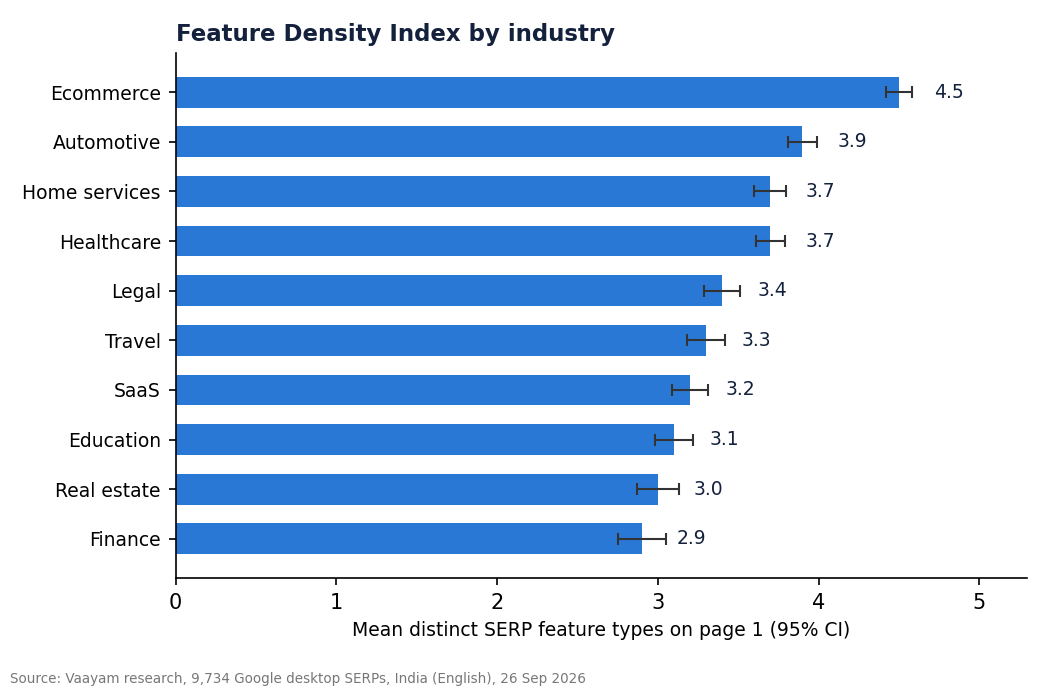
- Feature Density Index ranges from 4.5 in Ecommerce to 2.9 in Finance, a spread of 1.6 feature types.
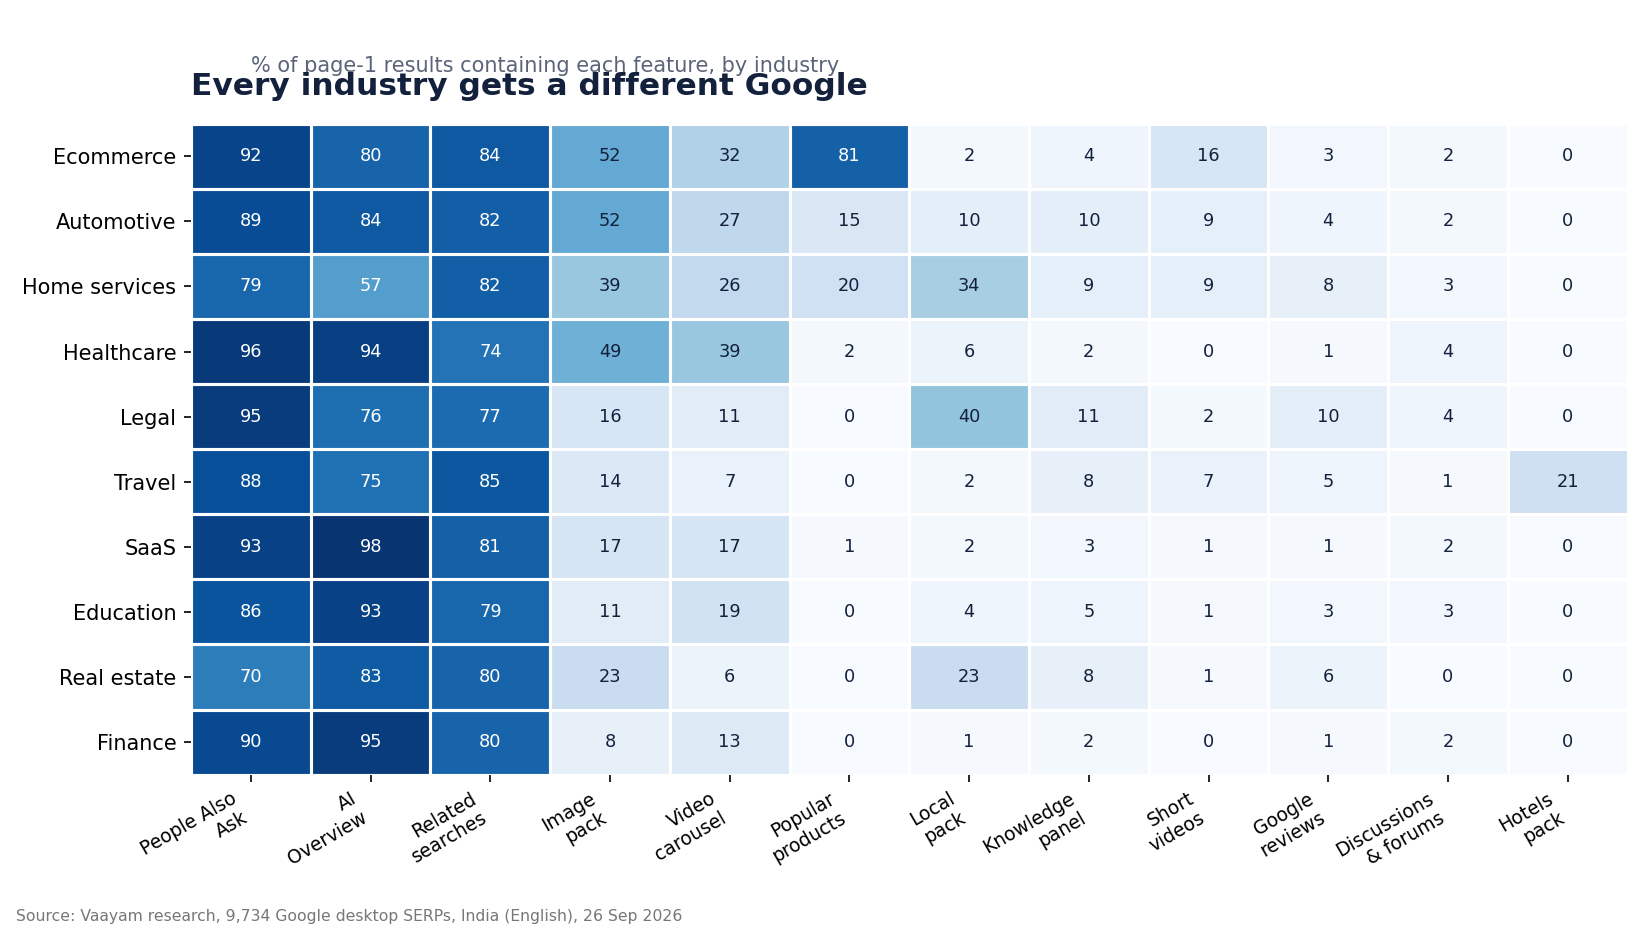
- Popular products is the feature most tied to industry (Cramér's V 0.74): 81% of Ecommerce page 1s, about 0% of Legal ones.
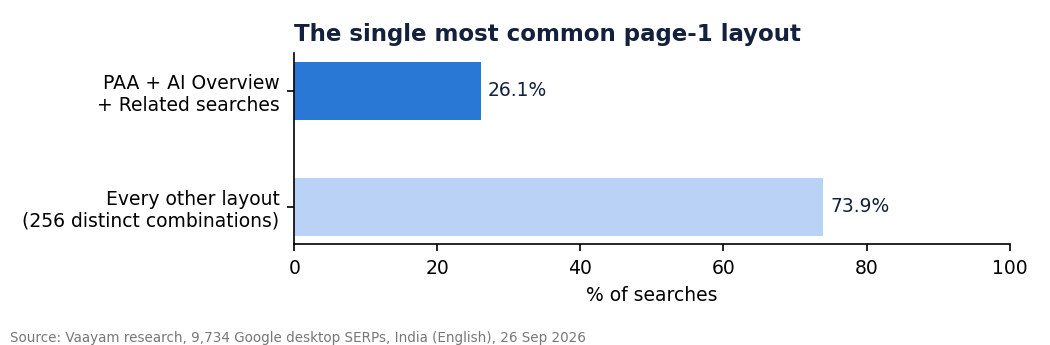
- The single most common page-1 layout, PAA + AI Overview + Related searches, appears on 26.1% of searches, out of 257 distinct layouts.
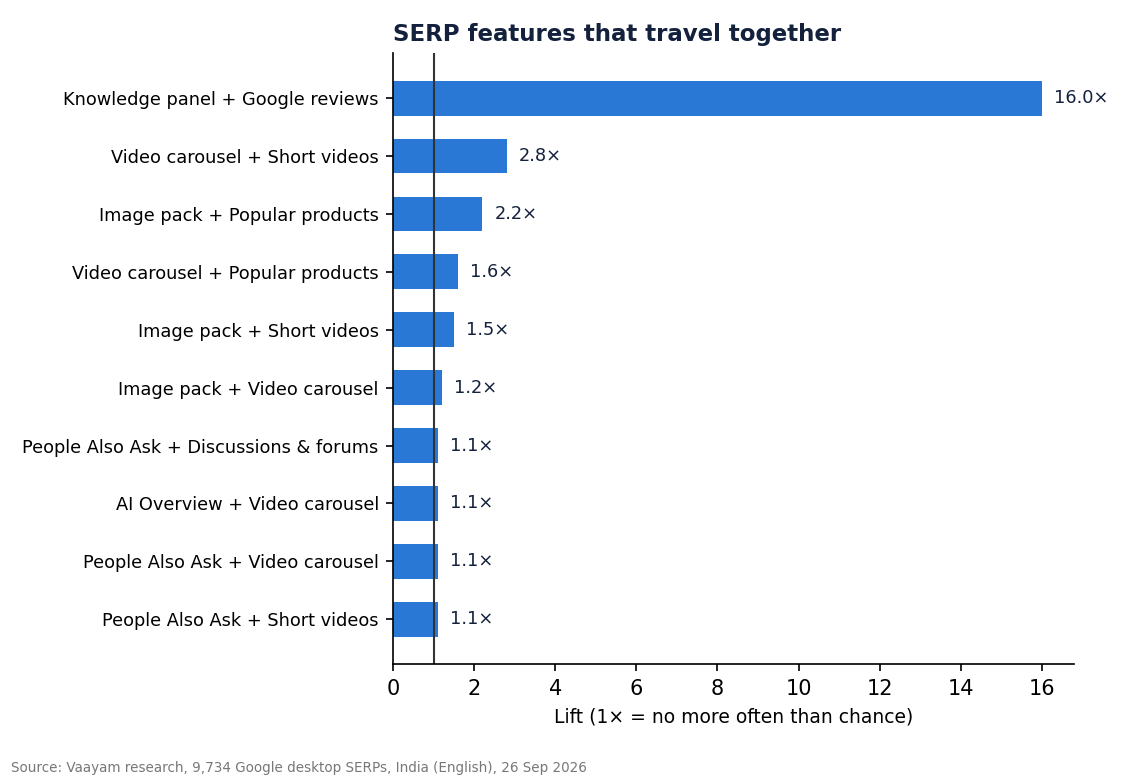
- Knowledge panel and Google reviews appear together at 16× the rate chance would predict.
1. Ecommerce pages are the most crowded; Finance the least
The Feature Density Index measures the mean number of distinct non-organic feature types on a page 1. Ecommerce tops the list at 4.5, followed by Automotive (3.9) and a cluster of Home services and Healthcare at 3.7. Finance sits lowest at 2.9, with Real estate just above it at 3.0. The 95% confidence intervals are tight, between about ±0.07 and ±0.15, so the ranking is not noise: some industries simply get a busier page than others.
2. Popular products is almost an Ecommerce-only feature
Across every feature we measured, Popular products varies most by industry, with a Cramér's V of 0.74. It shows up on 81% of Ecommerce page 1s and close to 0% of Legal ones. The next most industry-dependent features are Hotels pack (0.44), Local pack (0.42) and Image pack (0.38). The heatmap below shows the full picture: every industry gets a page 1 shaped around what people in that category are actually trying to do.
3. One layout beats the other 256 combined, but only just
Across the dataset we found 257 distinct combinations of SERP features. The most common single layout, People Also Ask plus an AI Overview plus Related searches, appears on 26.1% of all searches. That means roughly three in four page 1s follow some other combination entirely. There is no single "typical" SERP; there is a dominant pattern and a long tail.
4. Some features cluster, and AI Overviews avoid local ones
Among feature pairs that appear together on at least 2% of searches, Knowledge panel and Google reviews stand out: they co-occur 16 times more often than chance would predict, far ahead of the next pairing, Video carousel and Short videos, at 2.8×. At the other end, AI Overviews are somewhat less likely to appear alongside local, trust-signalling features: the lift is 0.7× for Local pack, Google reviews and Knowledge panel. Google appears to reach for an AI Overview or for local/reputation features, not both at once.
What to do with this data
If you run SEO: build your feature checklist from your own industry's row in the heatmap, not a generic best-practice list. If you work in Ecommerce or Automotive, Popular products and Image pack are worth real effort; if you work in Legal or Finance, spend that effort elsewhere, since those features barely appear in those categories regardless of how well a page is optimised.
If you run a brand: benchmark your SERP presence against your industry's Feature Density Index, not against "the market." An Ecommerce brand competing on a 4.5-feature page needs a different content and PR plan than a Finance brand competing on a 2.9-feature page. Ask your team which of the 257 layouts your priority keywords actually fall into, rather than assuming the single most common one applies to you.
If you work in marketing leadership: put maintaining your Google Business Profile and review volume on the same roadmap as content, not a separate one. Knowledge panels and Google reviews appear together at 16× the rate chance predicts, so investing in one largely pays off in the other. Conversely, don't expect an AI Overview push to also lift local or trust features: the two show up together slightly less than chance.
Method and limits
Results are a non-personalised desktop snapshot for India in English on a single day, so individual users may see something different. The sample represents those keyword neighbourhoods, not all Indian search. SaaS and Legal are smaller because off-topic keywords were removed. Cramér's V and lift describe association, not causation; every finding here is a correlation.